Electric vs Hybrid: Which Is Cheaper to Run in the UK?
Hybrid or full electric? We compare the real UK running costs for full hybrids, plug-in hybrids and battery electric cars. The winner depends on how you drive.
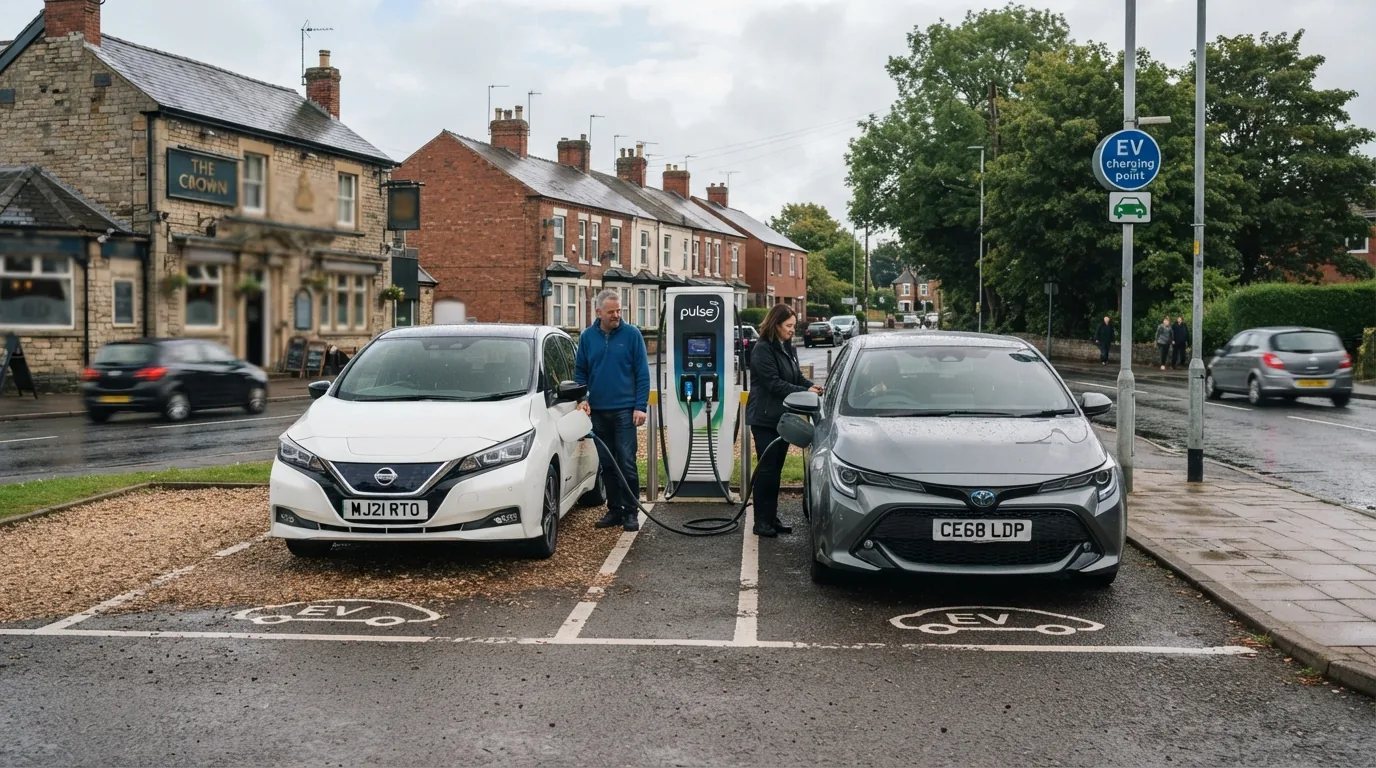
Quick answers
- The hybrid versus electric debate is one of the most common questions UK car buyers face in 2026. Both reduce emissions and fuel consumption compared to a petrol car.
- Running costs per mile: the numbers: For a consistent comparison, we use 10,000 miles per year and electricity at 8p per kWh (home, Intelligent Octopus Go) or 52p per kWh (public rapid charger), and petrol at £1.50 per litre.
- The PHEV trap: Plug-in hybrids offer official fuel economy figures that look extraordinary on paper: some models show 200 to 300 mpg in official testing.
- Tax: where the BEV dominates: The benefit-in-kind (BIK) tax difference between vehicle types is enormous and matters significantly for company car drivers.
- Maintenance: BEV wins again: Over five years, this gives the BEV a maintenance saving of roughly £300 to £575 compared with hybrids, assuming no major repairs.
- Range anxiety: honest assessment: The one area where hybrids maintain a clear advantage is range anxiety and flexibility.
The hybrid versus electric debate is one of the most common questions UK car buyers face in 2026. Both reduce emissions and fuel consumption compared to a petrol car. Both can make financial sense. But they suit very different drivers, and the running cost gap between them is larger than most buyers expect.
The direct answer: if you can charge at home and drive more than 8,000 miles a year, a full electric car is cheaper to run than any type of hybrid. If you cannot charge at home or rely heavily on motorway driving, a full hybrid or plug-in hybrid may be more practical and comparable in cost.
Three types of hybrid: a quick clarification
Before comparing costs, it is worth distinguishing the three types of vehicle on offer:
Full hybrid (HEV): A conventional petrol engine supplemented by a small battery that charges automatically through regenerative braking. You never plug in. Examples: Toyota Yaris Hybrid, Toyota Corolla Hybrid.
Plug-in hybrid (PHEV): A larger battery that you can charge from the mains, offering a meaningful electric-only range (typically 30 to 60 miles), with a petrol engine for longer journeys. Examples: Mitsubishi Outlander PHEV, BMW 330e.
Battery Electric Vehicle (BEV): No combustion engine. Electricity only. Range typically 150 to 400 miles on a charge. Examples: Nissan Leaf, Kia EV6, Tesla Model 3.
Running costs per mile: the numbers
For a consistent comparison, we use 10,000 miles per year and electricity at 8p per kWh (home, Intelligent Octopus Go) or 52p per kWh (public rapid charger), and petrol at £1.50 per litre.
| Vehicle type | Fuel/energy cost per mile | Annual fuel cost (10,000 mi) |
|---|---|---|
| Full hybrid (HEV) | ~10p/mile (55 mpg) | ~£1,042 |
| PHEV (charged regularly) | ~3-5p/mile (mixed electric/petrol) | ~£430-£650 |
| PHEV (rarely charged) | ~14-16p/mile (petrol-heavy) | ~£1,350-£1,500 |
| BEV (home charging, 8p/kWh) | ~1.8-2.5p/mile | ~£155-£220 |
| BEV (public charging, 52p/kWh) | ~12-14p/mile | ~£1,050-£1,200 |
The critical observation: a PHEV that is charged regularly delivers running costs close to a BEV. A PHEV that is rarely plugged in delivers running costs worse than a full hybrid. This is the hidden risk of PHEV ownership, and it is significant.
The PHEV trap
Plug-in hybrids offer official fuel economy figures that look extraordinary on paper: some models show 200 to 300 mpg in official testing. These figures are calculated assuming frequent charging, which reflects lab conditions rather than real-world behaviour. Real-world PHEV fuel economy, averaged across the actual UK PHEV fleet, is much lower. Studies have found PHEVs averaging closer to 35 to 50 mpg in real-world use when owners do not charge regularly.
If you are considering a PHEV, ask yourself honestly: will you plug it in every night? If the answer is not a confident yes, a full hybrid or a BEV will likely serve you better.
Head to head: specific models
| Toyota Corolla Hybrid 1.8 | BMW 330e PHEV | Volkswagen ID.3 Pro (BEV) | |
|---|---|---|---|
| UK OTR price from | ~£31,650 | ~£47,190 | ~£37,995 |
| Annual fuel cost (10,000 mi) | ~£1,040 | ~£430-£1,400 | ~£160 (home) |
| BIK rate 2026/27 | ~26% | ~8% | 4% |
| Annual VED | £195 | £195 | £195 |
| Annual service cost | ~£220 | ~£280 | ~£165 |
| Charging required | No | Yes (optimal) | Yes |
Tax: where the BEV dominates
The benefit-in-kind (BIK) tax difference between vehicle types is enormous and matters significantly for company car drivers. In 2026/27:
- Full hybrids: BIK rates of 20 to 28 per cent based on CO2 emissions
- PHEVs: BIK rates of 8 to 14 per cent (depending on electric-only range and emissions)
- BEVs: 4 per cent flat, rising 1 per cent per year to 9 per cent in 2030
A 40% taxpayer in a Toyota Corolla Hybrid (list price ~£31,650, BIK ~26%) pays around £3,292 per year in benefit-in-kind tax. The same taxpayer in a BMW 330e PHEV (list price ~£47,190, BIK ~8%) pays around £1,510 per year. In a Volkswagen ID.3 Pro (list price ~£37,995, BIK 4%) they pay around £607 per year.
For company car drivers, the BEV is cheaper on tax alone by over £1,000 per year compared with the best-in-class PHEV, and by over £2,600 per year compared with a conventional hybrid.
Maintenance: BEV wins again
Electric cars have fewer moving parts than hybrids. No oil changes, no coolant flushes, fewer brake pad replacements (due to regenerative braking). The average annual EV service cost is around £165 versus £220 for a hybrid and £280 for a PHEV (the PHEV cost is elevated because it maintains two separate drivetrains).
Over five years, this gives the BEV a maintenance saving of roughly £300 to £575 compared with hybrids, assuming no major repairs.
Range anxiety: honest assessment
The one area where hybrids maintain a clear advantage is range anxiety and flexibility. A hybrid or PHEV can refuel at any petrol station in minutes. A BEV requires either home charging or access to a public rapid charger, and public charging takes longer than a petrol top-up.
For long-distance UK driving (regular 200-plus mile journeys), a PHEV or full hybrid remains the lower-stress option if you are not comfortable with EV route planning. For drivers who do the vast majority of their miles locally and charge at home overnight, this advantage disappears.
The UK average daily driving distance is under 20 miles. For the overwhelming majority of journeys, any of the three types will work without issue.
Who should choose what?
Full BEV is best for:
- Company car drivers at any mileage (the BIK advantage is decisive)
- Private drivers doing 8,000+ miles per year with home charging access
- Urban and suburban commuters with predictable daily distances
- Anyone who values low maintenance and simple running costs
PHEV is best for:
- Long-distance drivers who want petrol backup for motorway journeys
- Buyers who will genuinely charge every night and drive mostly short daily distances on electric
- Drivers transitioning from petrol who want a safety net during the change
Full hybrid (HEV) is best for:
- Drivers who cannot charge at home and drive a mix of urban and motorway miles
- High annual mileage motorway drivers where hybrid regeneration is less effective but petrol efficiency is still decent
- Those who want improved economy over a pure petrol car with no charging infrastructure changes required
The common myth
The most persistent myth is that a PHEV is “the best of both worlds” and therefore the rational choice. In practice, a PHEV that is not charged regularly is worse than both a full hybrid (on fuel economy) and a BEV (on running costs and tax). The “best of both worlds” only materialises if you commit to plugging in. If you are going to commit to plugging in, you may as well go fully electric.
What to read next
For the complete guide to running costs including VED, servicing and home charging tariffs, visit our Running Costs & Tax guide. If you are ready to compare specific models on cost, see our cheapest electric cars to run page.
How we test and where our numbers come from
Range figures are official WLTP combined values taken from manufacturer UK specification pages, with real-world estimates drawn from independent comparative testing. Prices are UK list prices at the time of the latest update. Tax, grant and charging-scheme figures come from GOV.UK and HMRC publications. We re-check every guide when pricing, specification or policy changes. Last checked 11 August 2026.

EV Compared
The EV Compared editorial team tracks the UK electric vehicle market full time: new model launches, list prices, WLTP and real-world range, public charging tariffs and the tax rules that decide what an EV actually costs to run. Every guide is checked against manufacturer specifications and official GOV.UK figures, and updated whenever the numbers move.
Related reading
View all
What Are the Biggest Myths About Switching to an EV?
The claims that put UK drivers off going electric, and what the evidence actually says

Should You Buy an EV in 2026 or Wait for Cheaper Models?
An honest look at where EV prices are heading and whether the wait is worth it for UK buyers
Buying and Owning an Electric Car in the UK: The Complete 2026 Guide
Everything you need to know about costs, charging, depreciation and day-to-day life with an EV